Analytics Overview
Track revenue, gate performance, and subscriber growth across all your domains.
Go to Dashboard → Analytics for a high-level view of your monetization performance.
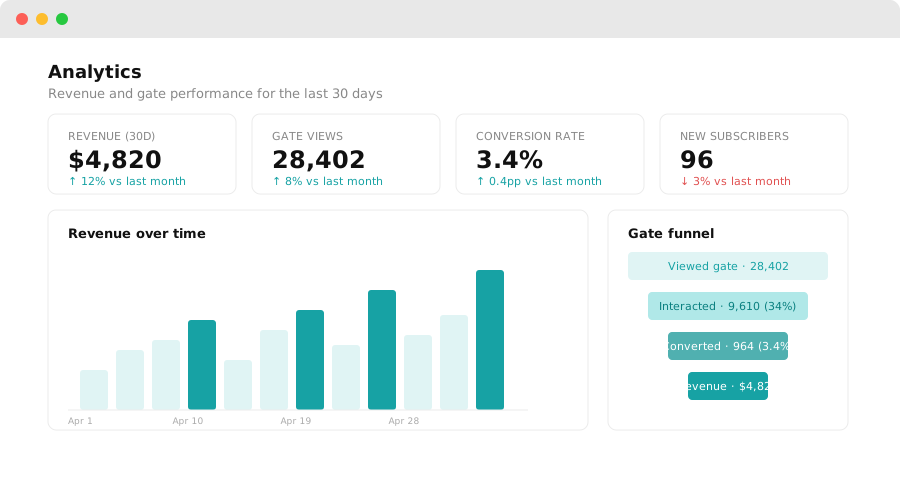
Key metrics
| Metric | Description |
|---|---|
| Monthly revenue | Total revenue in the current calendar month |
| Active subscribers | Readers with a currently active paid subscription |
| Conversion rate | Gate impressions that resulted in a subscription or unlock |
| Gate impressions | Total number of times a gate was shown to a reader |
Revenue breakdown
The revenue chart shows daily or monthly revenue broken down by:
- Subscriptions — recurring subscription payments
- Article unlocks — one-time article unlock payments
Toggle between 7 days, 30 days, and 90 days to see different time windows.
Subscriber growth
The subscriber growth chart shows cumulative active subscribers over time. A rising trend means you're adding subscribers faster than you're losing them.
Churn is shown separately — the number of subscribers who cancelled in each period.
Gate performance table
Below the charts, a table shows each of your gates with:
- Impressions
- Conversions
- Conversion rate
- Revenue attributed to that gate
Use this to identify which gates are performing well and which need adjustment.
Hourly activity
The overview shows an hourly heatmap of gate impressions for the current day. Use this to understand when your readers are most active.